
President Trump addressed the nation Tuesday night about what he calls, “a growing humanitarian and security crisis” at the southern border. As the government shutdown persists, here’s what we know about migration into the United States and what’s happening at the U.S.- Mexico border.
Nationwide apprehensions of migrants entering the U.S. illegally

500,000
1.5 million
1 million
0
1970
231,116
In 1986, U.S. Border Patrol
detained 1.69 million
people attempting to enter
the United States without
authorization, the most
on record.
1980
1990
2000
2000 set the second-highest record for apprehensions by U.S. border agents at 1.67 million.
2010
Despite overall declines,
there’s been a slight increase
in families from some Central
American countries attempting
to enter the United States
to seek safer conditions.
2018
403,479

500,000
1 million
1.5 million
0
231,116
1970
In 1986, U.S. Border Patrol
detained 1.69 million
people attempting to enter
the United States without
authorization, the most
on record.
1980
1990
2000
2000 set the second-highest record
for apprehensions by
U.S. border agents
at 1.67 million.
2010
Despite overall declines,
there’s been a slight
increase in families from
some Central American
countries attempting to
enter the United States
to seek safer conditions.
2018
403,479

2000 set the second-highest record
for apprehensions by
U.S. border agents
at 1.67 million.
In 1986, U.S. Border Patrol
detained 1.69 million
people attempting to enter
the United States without
authorization, the most
on record.
Despite overall declines,
there’s been a slight
increase in families from
some Central American
countries attempting to
enter the United States
to seek safer conditions.
1.5M
1M
500K
403,479
231,116
0
1970
1980
1990
2000
2010
2018

2000 set the second-highest record for apprehensions by
U.S. border agents
at 1.67 million.
In 1986, U.S. Border Patrol
detained 1.69 million
people attempting to enter
the United States without
authorization, the most
on record.
Despite overall declines,
there’s been a slight
increase in families from
some Central American
countries attempting to
enter the United States
to seek safer conditions.
1180px
1.5 million
1 million
403,479
500,000
231,116
0
1980
1990
2000
2010
2018
1970

2000 set the second-highest record for apprehensions by U.S. border agents at 1.67 million.
In 1986, U.S. Border Patrol
detained 1.69 million people
attempting to enter the
United States without
authorization, the most
on record.
Despite overall declines,
there’s been a slight
increase in families from
some Central American
countries attempting to
enter the United States
to seek safer conditions.
1.5 million
1 million
500,000
403,479
231,116
0
1970
1980
1990
2000
2010
2018
Figures released by the Department of Homeland Security show nationwide apprehensions of migrants entering the country without authorization are at some of their lowest numbers in decades. The U.S. Border Patrol states on its website that these numbers do not include individuals met at ports of entry looking to enter legally, but are determined to be inadmissible, or individuals seeking humanitarian protection under U.S. law.
U.S. Border Patrol took just over 400,000 people illegally entering the United States into custody in 2018, down from the second-high of 1.67 million in 2000.
The Washington Post Fact Checker Salvador Rizzo reported that most of these declines have come, “partly because of technology upgrades; tougher penalties in the wake of the 9/11 terrorist attacks; a decline in migration rates from Mexico; and a sharp increase in the number of Border Patrol officers.”
The first iteration of current fencing along the U.S.-Mexico took place during the 1990s where the administrations of Presidents George H.W. Bush and Bill Clinton authorized the construction of fencing along the California-Mexico border. Then, in 2006, President George W. Bush expanded the border fence by signing the Secure Fence Act into law, which authorized the construction of a fence along 700 miles of the U.S.-Mexico border.

Apprehensions:
NORTH
For Fiscal Year 2017
Less
More
Fence type:
Los
Angeles
Pedestrian
San
Diego
Vehicle
Tijuana
CALIF.
U.S.
Mexicali
Sonoyta
ARIZONA
Tucson
Nogales
NEW
MEXICO
250 MILES
Ciudad
Juarez
El Paso
Presidio
Big
Bend
U.S.
TEXAS
Piedras
Negras
Eagle Pass
Laredo
Reynosa
Corpus
Christi
Brownsville
Houston
Matamoros
Gulf of Mexico

Apprehensions:
For Fiscal Year 2017
NORTH
Less
More
Fence type:
Los
Angeles
Pedestrian
San
Diego
Vehicle
Tijuana
CALIF.
U.S.
Mexicali
Sonoyta
ARIZONA
Tucson
Nogales
NEW
MEXICO
250 MILES
Ciudad
Juarez
El Paso
Presidio
Big
Bend
U.S.
TEXAS
Piedras
Negras
Eagle Pass
Laredo
Reynosa
Corpus
Christi
Brownsville
Houston
Matamoros
Gulf of Mexico

Fence type:
Apprehensions:
Pedestrian
Vehicle
Less
More
CALIF.
ARIZ.
N.M.
TEXAS
Houston
San Diego
El Paso
Tucson
U.S.
Ciudad
Juarez
Tijuana
Sonoyta
Presidio
Nogales
Eagle Pass
Piedras
Negras
Laredo
MEXICO
Brownsville
Reynosa
Matamoros
250 MILES

Fence type:
Apprehensions:
Pedestrian
Vehicle
Less
More
CALIF.
ARIZONA
NEW MEXICO
TEXAS
Houston
San Diego
El Paso
Tucson
U.S.
Ciudad
Juarez
Tijuana
Sonoyta
Nogales
Presidio
Eagle Pass
Piedras
Negras
Laredo
MEXICO
Brownsville
Reynosa
250 MILES
Matamoros

Fence type:
Pedestrian
Vehicle
Border Patrol apprehensions in FY 2017:
Less
More
CALIFORNIA
ARIZONA
NEW MEXICO
TEXAS
Houston
El Paso
Tucson
San Diego
Ciudad
Juarez
U.S.
Mexicali
Tijuana
Sonoyta
Nogales
Corpus
Christi
Presidio
Eagle Pass
Piedras
Negras
Pacific
Ocean
Gulf of
Mexico
Laredo
MEXICO
Brownsville
Reynosa
Matamoros
250 MILES
Note: Apprehension data for fiscal year 2017
Despite Trump’s repeated claim that terrorists are entering through the southern border, the State Department reported that at the end of 2017, “there was no credible evidence indicating that international terrorist groups have established bases in Mexico, worked with Mexican drug cartels, or sent operatives via Mexico into the United States,” and noted, “The U.S. southern border remains vulnerable to potential terrorist transit, although terrorist groups likely seek other means of trying to enter the United States.”

A man holds a Mexican migrant child as he jumps the border fence to get into the U.S. side to San Diego, from Tijuana, Mexico. (Daniel Ochoa de Olza/AP)
Speaking with NPR in 2017, Tom Homan, acting director of Immigration and Customs Enforcement, said, “Overall, removals are down because the border's under better control than it has been in 45 years."
Apprehensions of unaccompanied minors by nationality

22,327
Guatemala
20K
Honduras
10,913
10K
10,136
Mexico
4,949
El Salvador
0
2014
2018

22,327
22,327
Guatemala
Guatemala
20K
20K
Honduras
Honduras
10,913
10,913
10K
10K
10,136
10,136
Mexico
Mexico
4,949
4,949
El Salvador
El Salvador
0
0
2014
2014
2018
2018

22,327
Guatemala
20K
Honduras
10,913
10K
10,136
Mexico
4,949
El Salvador
0
2014
2018

22,327
Guatemala
20,000
Honduras
10,913
10,000
10,136
Mexico
4,949
El Salvador
0
2014
2018
Apprehensions of unaccompanied minors at the border from El Salvador, Honduras and Mexico began to decline in 2016 and 2017 from previous highs in 2014, according to Border Patrol statistics. Guatemala, however, has seen a large increase in apprehensions of minors of the border, reaching a high of just over 22,000 in 2018, the largest of any country within the past five years.
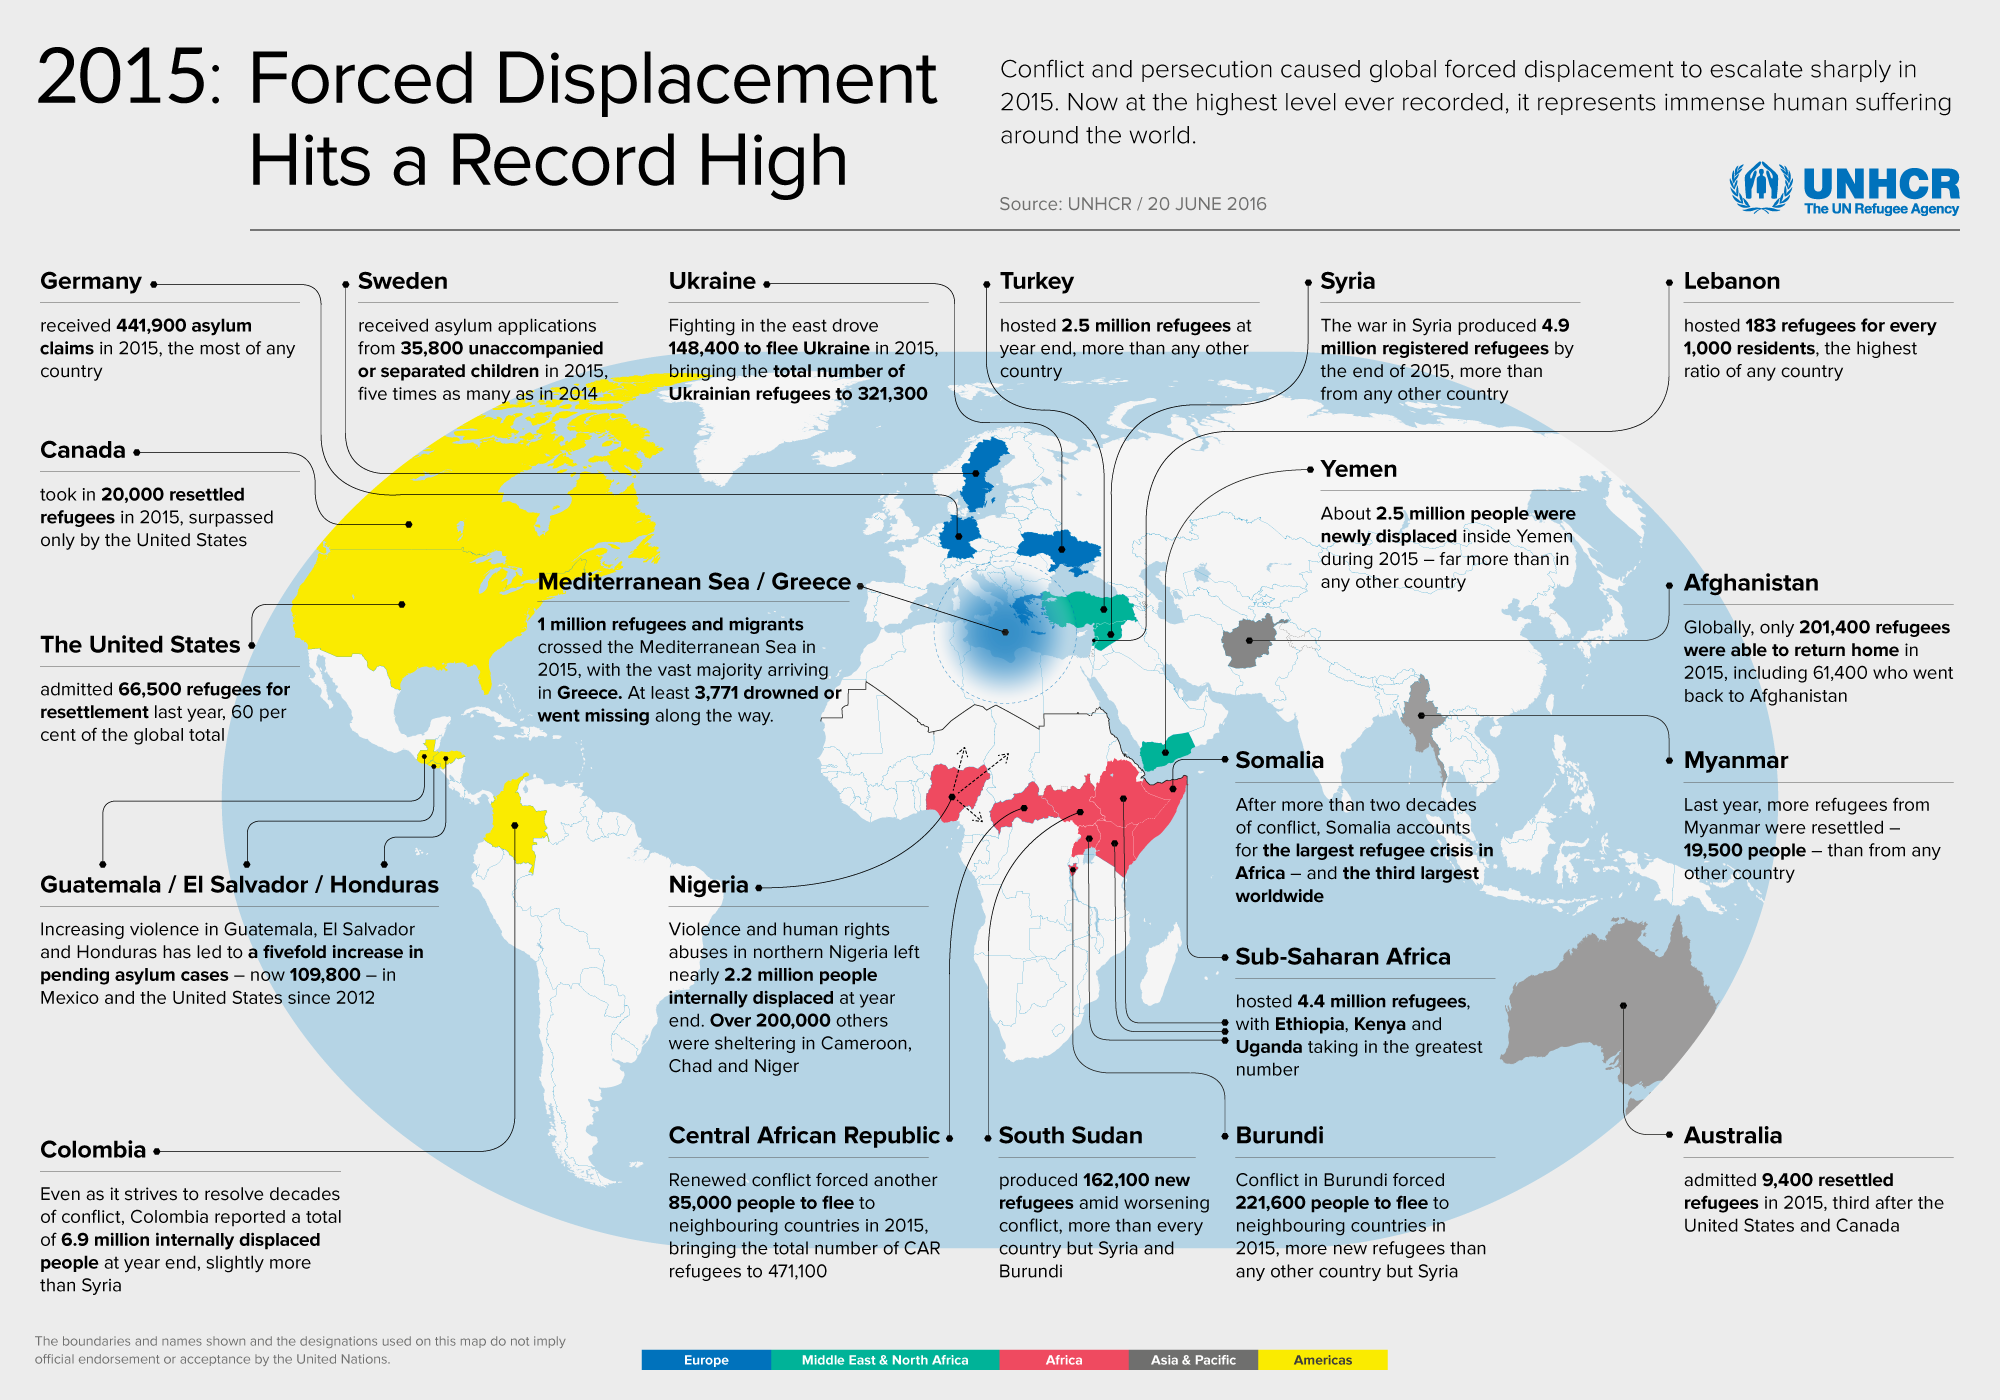
The rise of violence in some Central American countries has caused migrants and asylum seekers to head to the United States. According to a U.N. High Commissioner for Refugees report from 2015, “increasing violence in Guatemala, El Salvador and Honduras has led to a fivefold increase in pending asylum cases — now 109,800 — in Mexico and the United States since 2012.”
Where migrants are detained at the southwest border

NV.
Yuma
N.M.
TEXAS
El
Centro
Laredo
AZ.
El Paso
CA.
Del
Rio
Tucson
Big
Bend
San
Diego
Tucson
317,696
300K
200K
162,262
R.Grande
Valley
100K
Tucson
52,172
38,591
San Diego
0
2008
2018

NEV.
Yuma
N.M.
TEXAS
El
Centro
Laredo
ARIZ.
El Paso
CALIF.
Del
Rio
Tucson
San
Diego
Big
Bend
Tucson
317,696
300K
200K
162,262
R. Grande
Valley
100K
Tucson
52,172
38,591
San Diego
0
2008
2018

NEV.
Yuma
TEXAS
N.M.
CALIF.
Laredo
ARIZONA
El
Centro
El Paso
Del
Rio
Tucson
San
Diego
Big
Bend
Tucson
317,696
300,000
200,000
162,262
Rio Grande
Valley
100,000
Tucson
52,172
38,591
San Diego
0
2008
2018

NEV.
Yuma
TEXAS
N.M.
CALIF.
Laredo
ARIZONA
El
Centro
El Paso
Del
Rio
Tucson
San
Diego
Big
Bend
Tucson
317,696
300,000
600px
200,000
162,262
Rio Grande
Valley
100,000
Tucson
52,172
38,591
San Diego
0
2008
2018
Detainments along the U.S.-Mexico border saw an overall decline of 81.5 percent from 2000 to 2017. The border fence near the Rio Grande Valley is the only border crossing that has seen an increase in apprehensions within that same time frame.

But, in December, U.S. border agents detained 60,782 migrants, many with children, attempting to enter the United States without authorization, according to statistics obtained by The Post. December marked the third consecutive month border agents detained more than 60,000 migrants.
The recent surge in migrants has led to crowded and unhealthy conditions as holding cells became crowded, unhealthy and filled with youths. Two Guatemalan children died after being taken into custody, prompting officials at the Department of Homeland Security to declare a “humanitarian and national security crisis.”
Tim Meko, Kevin Schaul and Kevin Uhrmacher contributed to this report.
About this story
All figures are from the U.S. Customs and Border Protection. All data is reported in fiscal years. The 2018 data includes numbers from fiscal 2019, which includes October through December 2018. In the nationwide chart, 2018 figure includes all nationwide apprehensions from October 2017 through Aug. 31, 2018, plus southwest border apprehensions from September 2018.
Originally published Jan. 9, 2019.
More stories
Navigating the border: The barriers that define the U.S.-Mexico borderline
What is along the nearly 2,000 miles of border that divides the U.S. from Mexico?

5 challenges Trump may face building a border wall
These logistical issues will be crucial to any border wall construction, no matter who pays for it.

How the world is heeding the call to ‘build that wall’
The world now has more border barriers than at any time in modern history, an increase driven by war, waves of migration and the threat of terrorism.
